MASTERY-PROJEKT 3 - Marketing Funnel Analysis for Metrocar Car Sharing App: User funnels and target group insights (June 2023)

project description
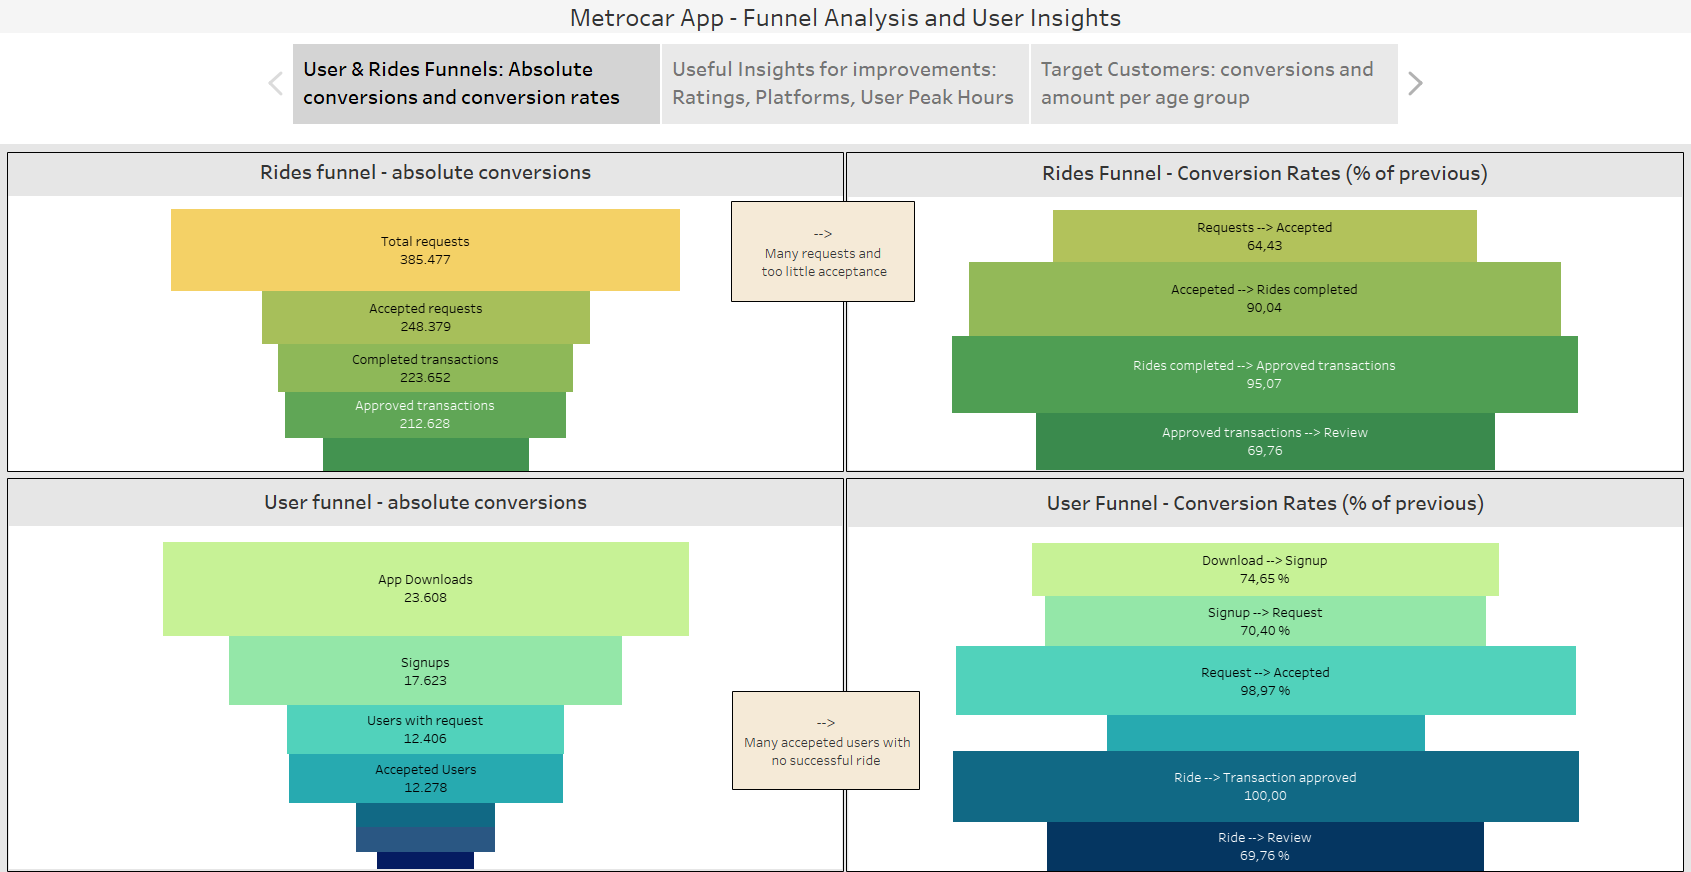
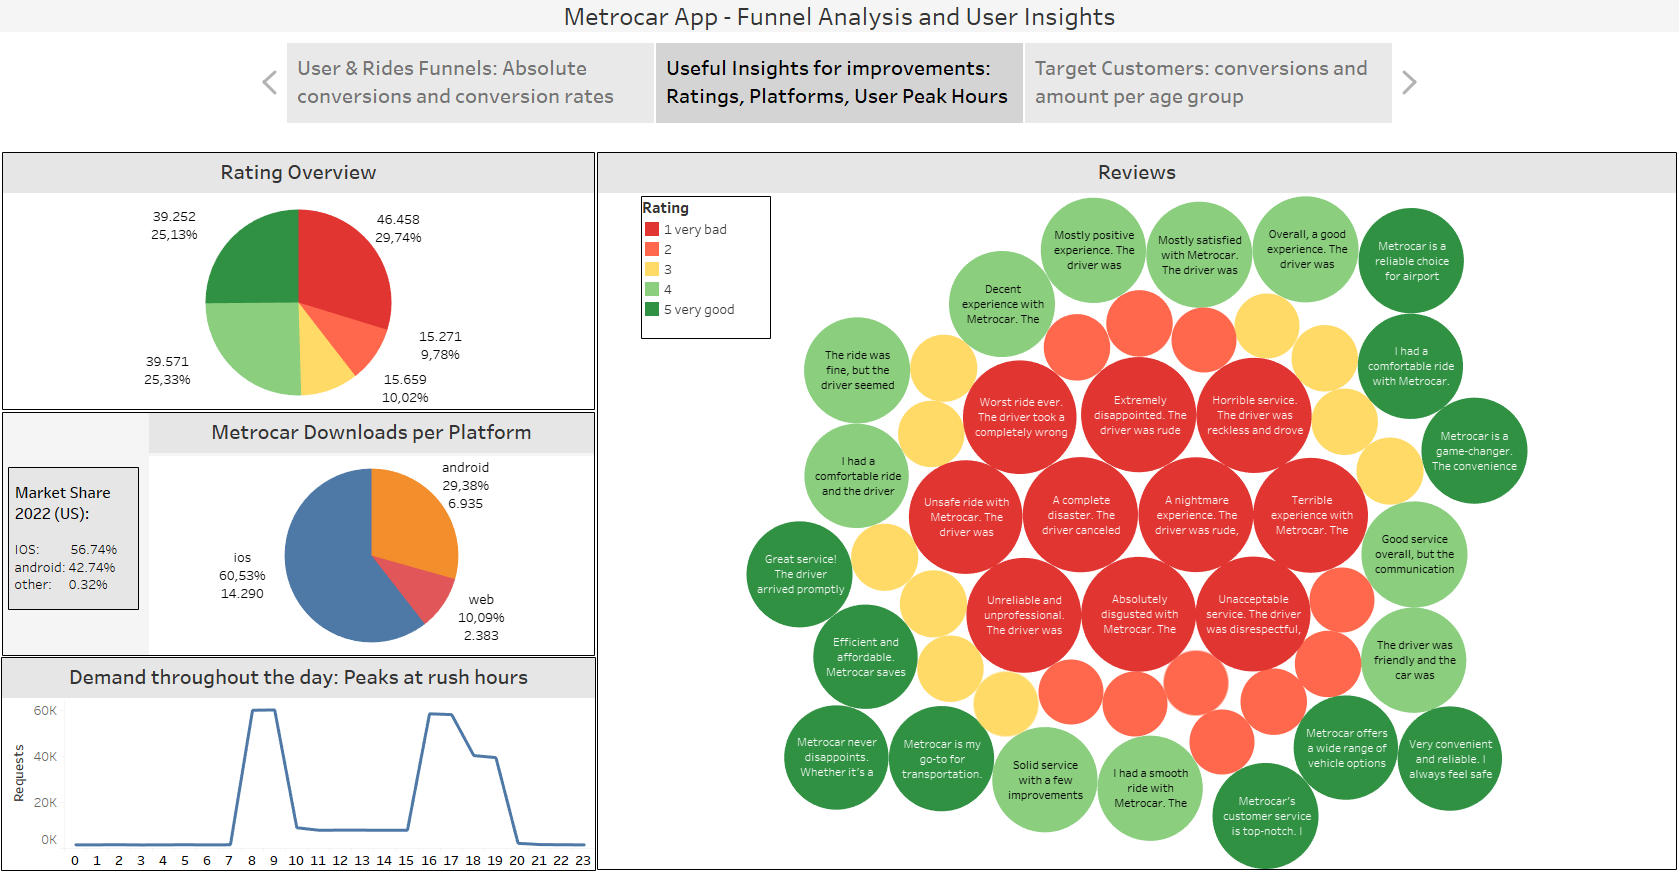
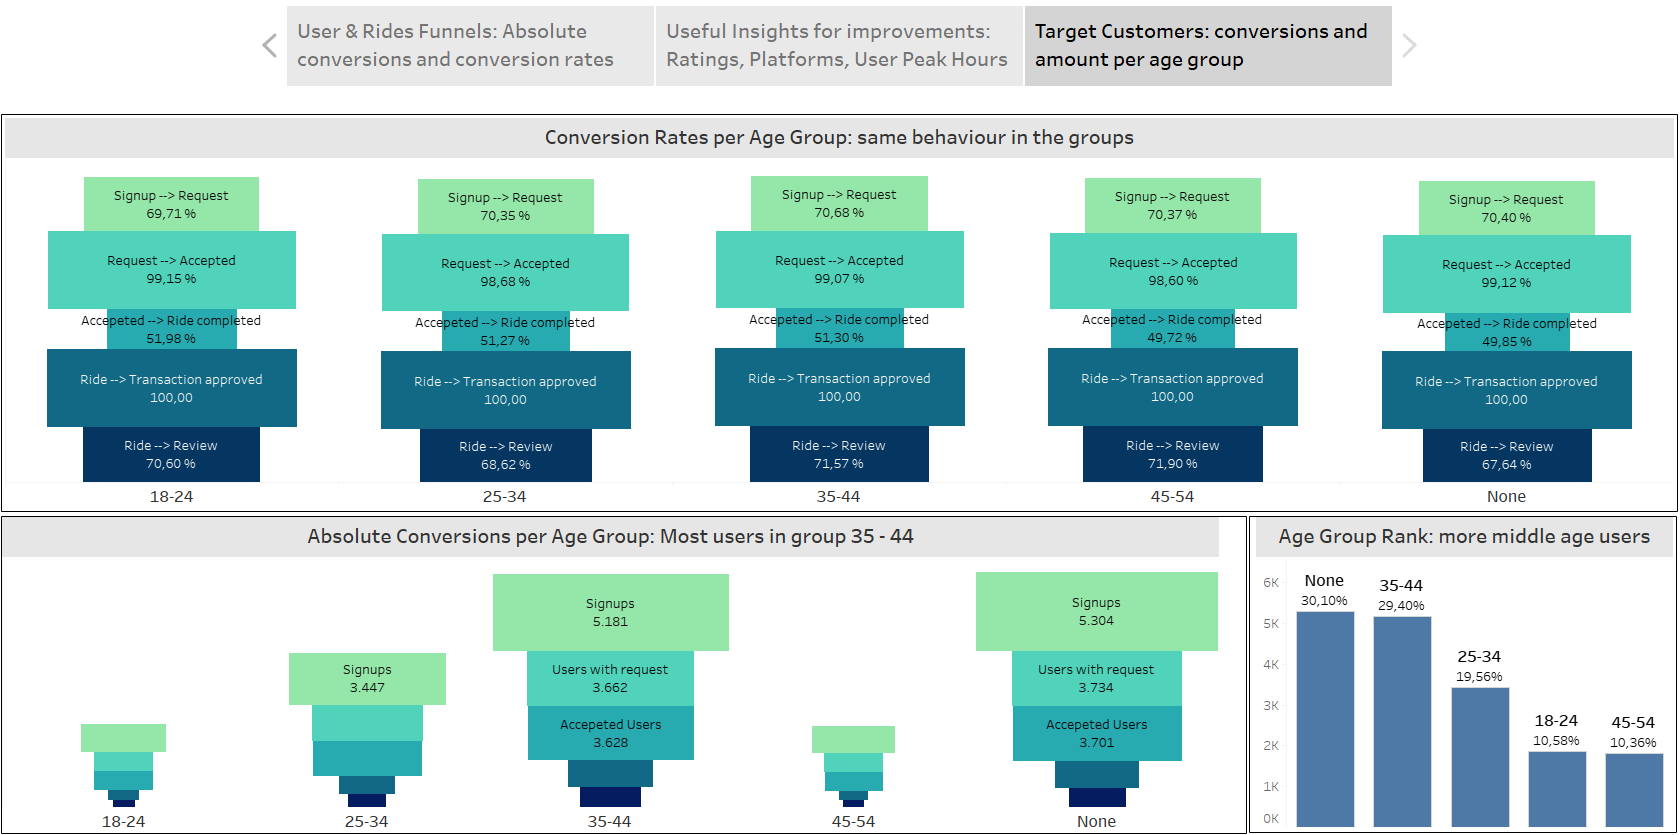
Metrocar is a ride-sharing app. A funnel analysis will be conducted to answer Metrocar's business questions to improve specific areas of the customer funnel. It should be clarified whether and where in the various phases from downloading the app to registration, the first inquiry to the completed journey and Transfer aborts are there to identify optimization areas. Furthermore, it was analyzed in which age groups most of the users are, whether their behavior differ from each other in how the demand varies throughout the day and how often and via which platforms the app is downloaded.Screenshots of the interaktive dashboards: